Accession No
4908
Brief Description
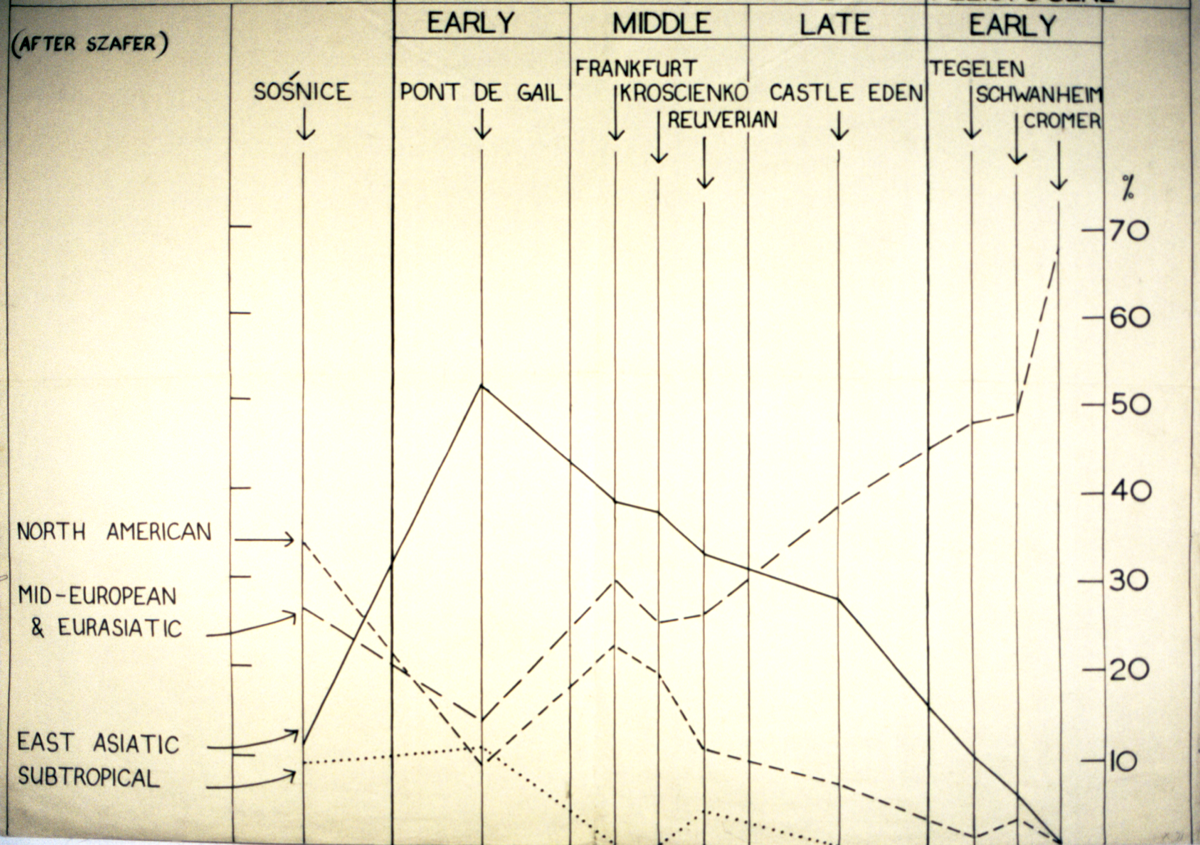
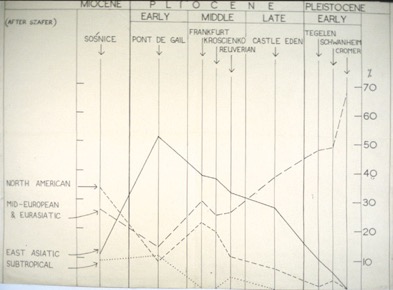
wallchart showing line graph, which charts variation in tertiary floras in the outer European zone, by G. B. 'Herbert' Newham, English, early to mid-20th Century
Origin
England; Cambridge
Maker
Newham, G. B. 'Herbert'
Class
natural history; earth sciences; prints
Earliest Date
1919
Latest Date
1967
Inscription Date
Material
cloth; paper
Dimensions
breadth 1384mm; height 1020mm
Special Collection
Botanical teaching diagrams from Dept. of Plant Sciences
Provenance
Transferred from the Department of Plant Sciences, University of Cambridge.
Inscription
‘(after szafer)’ (top left)
Description Notes
Wall chart showing line graph, which charts variation in tertiary floras in the outer European zone, by Newham, English, early to mid-20th Century.
Data for four locations (North America; Mid-European & Eurasiatic; East Asiatic; Subtropical) are plotted as lines or broken lines. These lines are labelled on the left. The y-axis is marked on the right, and runs from 0 to 70% of something.
The x-axis is labelled at the top and is divided into Miocene, Pliocene (early, middle and late) and Pleistocene (early). Vertical lines mark the divisions between these periods. More vertical lines are drawn in, and these are labelled at the top with place names (Sośnice, Pont de Gail, Frankfurt, Kroscienko, Reuverian, Castle Eden, Tegelen, Schwanheim, Cromer).
References
Events
FM:41518
Images (Click to view full size):