Accession No
4835
Brief Description
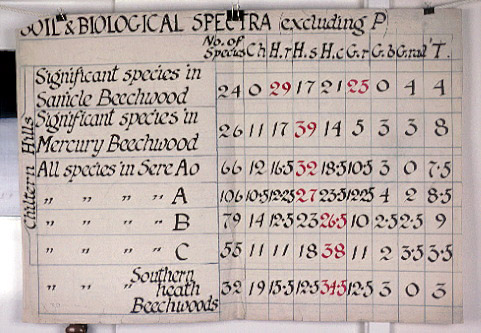
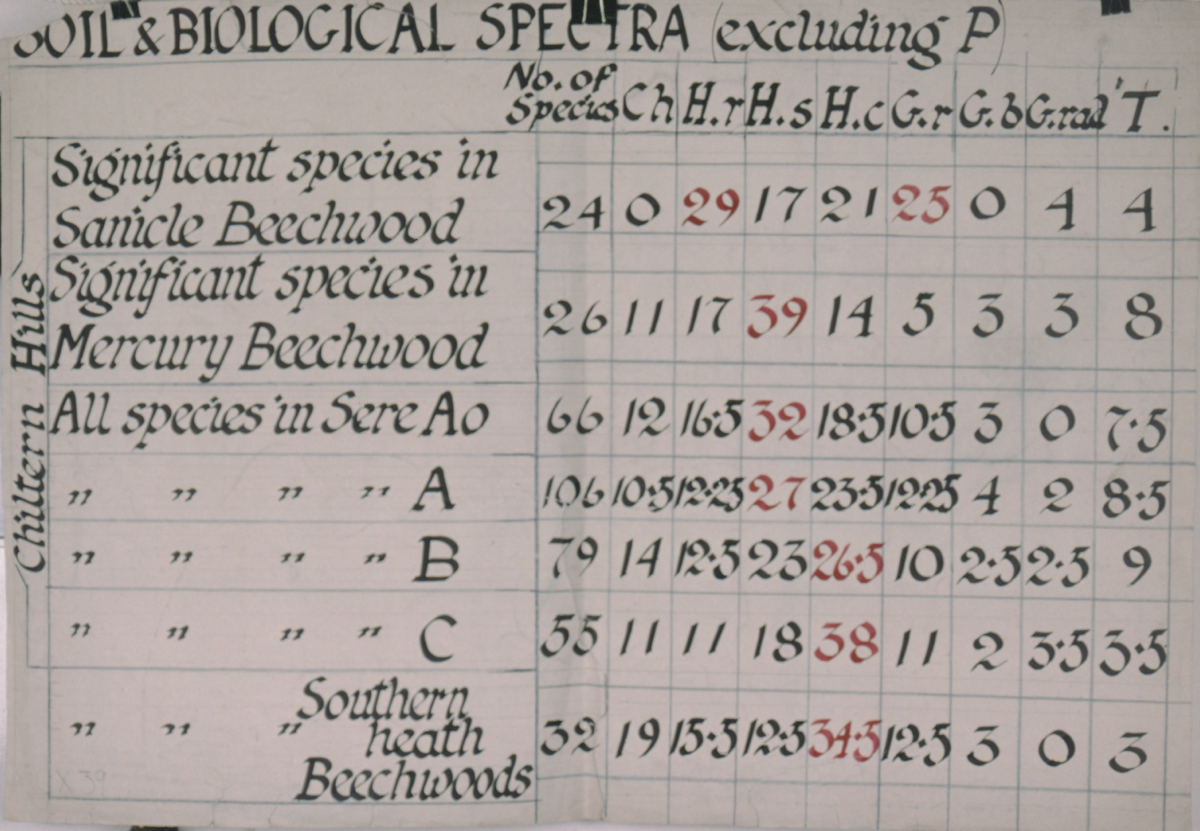
botanical wall chart showing table of results for soil and biological spectra for areas in the Chilterns, by G. B. 'Herbert' Newham, English, 20th century
Origin
Cambridge, England
Maker
Newham, G. B. 'Herbert'
Class
natural history; prints
Earliest Date
1919
Latest Date
1967
Inscription Date
Material
paper
Dimensions
breadth 1331mm; height 915mm
Special Collection
Botanical teaching diagrams from Dept. of Plant Sciences
Provenance
Transferred from the Department of Plant Sciences, University of Cambridge.
Inscription
‘SOIL & BIOLOGICAL SPECTRA (excluding P)’ (top)
Description Notes
Table of experimental results, giving soil and biological spectra.
Table is outlined in blue crayon, with text and numerical data in black (except for the highest numbers in each row, which are in red). It’s all hand written, with a very broad pen.
Nine narrow columns give the numerical data (number of species, ‘Ch’, ‘H.r’, ‘H.s’, ‘H.c’, ‘G.r’, ‘G.b’,’G.rad’, ‘T’) for the seven groups (Significant species in Sanicle Beechwood, and in Mercury Beechwood, All species in Sere Ao, A, B, C, and Southern heath Beechwoods). All but the last are in the Chiltern Hills.
Compare chart 4792, which plots climate and biological spectra.
References
Events
FM:41531
Images (Click to view full size):