Accession No
4823
Brief Description
botanical wall chart showing line graph of changes in light intensity in a Hertfordshire oakwood, by M. V. Smith, English, 20th century
Origin
Cambridge, England
Maker
Smith, M. V.
Class
natural history; prints
Earliest Date
1900
Latest Date
1967
Inscription Date
Material
paper; cloth
Dimensions
breadth 1529mm; height 1021mm
Special Collection
Botanical teaching diagrams from Dept. of Plant Sciences
Provenance
Transferred from the Department of Plant Sciences, University of Cambridge.
Inscription
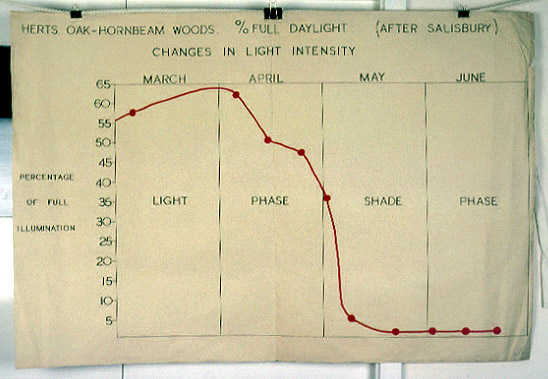
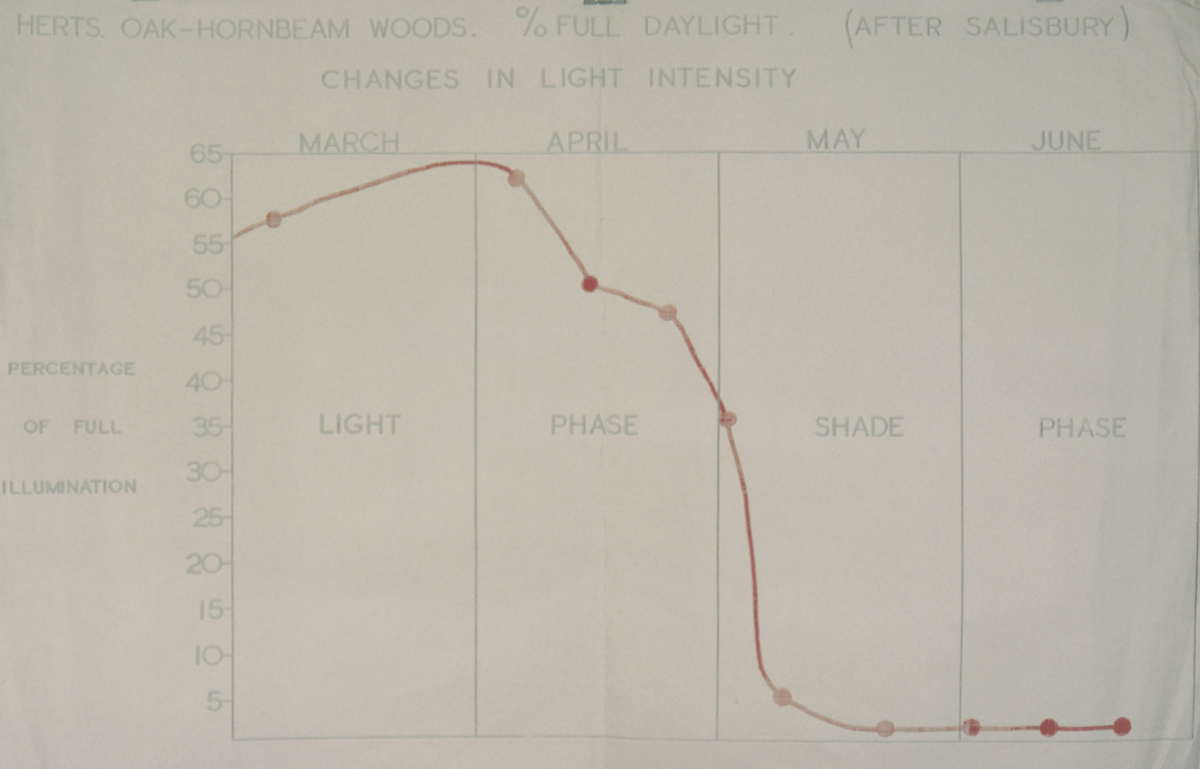
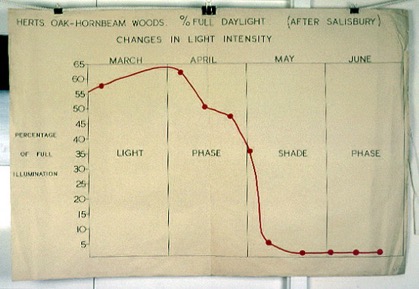
‘HERTS OAK-HORNBEAM WOODS. % FULL DAYLIGHT. (AFTER SALISBURY)
CHANGES IN LIGHT INTENSITY’ (top)
Description Notes
Botanical wall chart showing line graph of changes in light intensity in a Hertfordshire oakwood, by M. V. Smith, English, 20th century.
Title across top.
Line chart (line in red ink, with large red spots at each datum) shows percentage of full illumination (0-65%) in the wood from March to June. The months are divided by vertical black lines, and March-April is marked ‘light phase’, while May-June is marked ‘shade phase’. Ten points are plotted in all.
Text is stencilled capitals.
Ref number on reverse.
Fair condition.
References
Events
FM:41535
Images (Click to view full size):