Accession No
4819
Brief Description
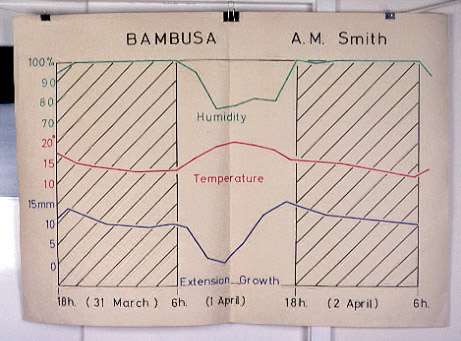
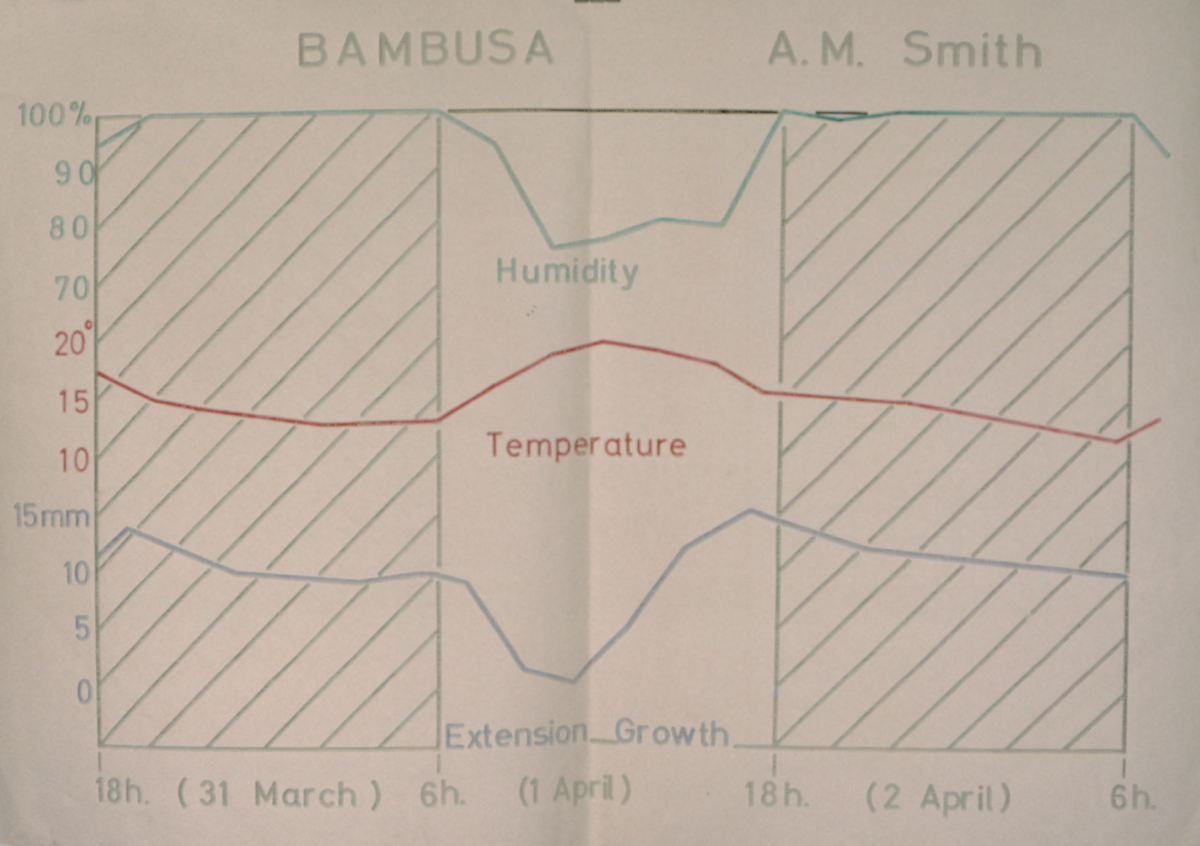
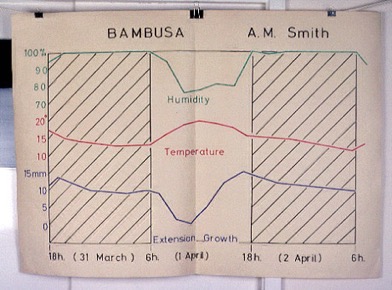
botanical wall chart showing line graph of the variation in humidity, temperature and extension growth for Bambusa, by A. M. Smith, English, 20th Century
Origin
England; Cambridge
Maker
Smith, A. M.
Class
natural history; prints
Earliest Date
1900
Latest Date
1967
Inscription Date
Material
paper; cloth
Dimensions
height 1022mm; breadth 1455mm
Special Collection
Botanical teaching diagrams from Dept. of Plant Sciences
Provenance
Transferred from the Department of Plant Sciences, University of Cambridge.
Inscription
‘BAMBUSA A.M. Smith’ (top)
Description Notes
Title across top.
Shows three line graphs, one above the other. x-axis is time, for three days.
The top graph (green) is the variation in humidity, the middle one (red) is temperature, while the blue line at the bottom shows extension growth.
Text is stencilled sentence case.
Ref number on reverse.
Good condition.
References
Events
FM:41537
Images (Click to view full size):